Why Do Global Buyers Need Dynamic Foot Pressure Analysis?

Time:2026-10-03 Author:Henry
0%

Global buyers increasingly need Dynamic Foot Pressure Analysis because footwear performance cannot be judged by appearance alone. A shoe may feel comfortable during a short fitting, yet create pressure beneath the heel, metatarsals, or big toe after prolonged walking. These hidden loading patterns matter across retail, sports, healthcare, and occupational footwear markets. They also vary by age, body mass, walking speed, surface, and regional foot morphology.

The World Health Organization’s 2022 Musculoskeletal Health report estimates that 1.71 billion people live with musculoskeletal conditions worldwide. Foot discomfort is not always a separate diagnosis, but it can influence mobility, work participation, and purchasing decisions. Grand View Research’s recent smart footwear analysis also identifies sensor-based technologies as a developing commercial segment. Buyers therefore need evidence beyond static sizing charts. They need measurable performance.

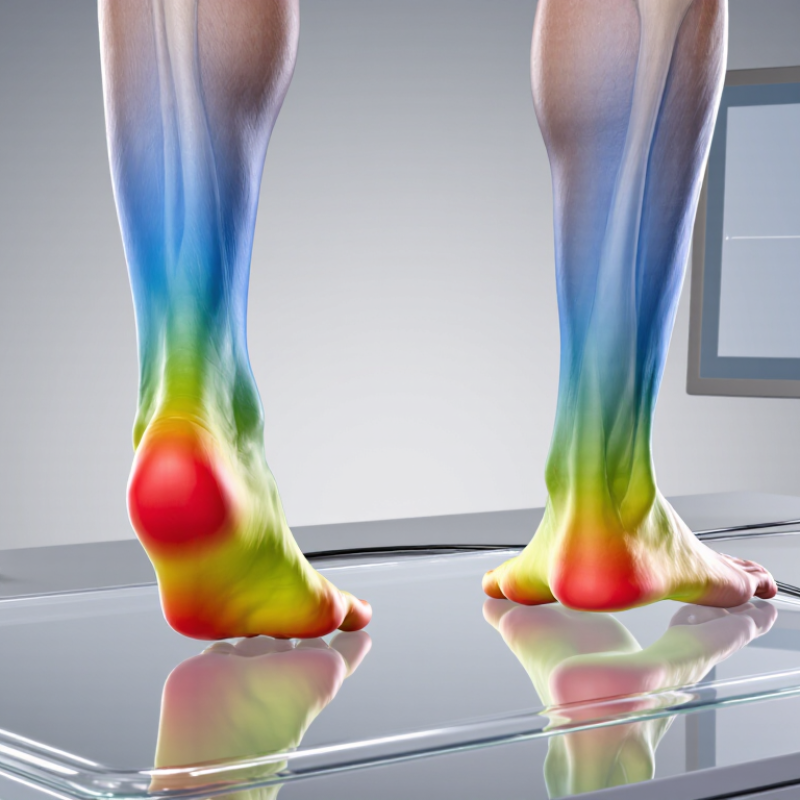
Foot-biomechanics researcher Dr. Irene Davis has stated, “The foot is a sensory organ, not just a lever.” That perspective explains why dynamic testing matters. Pressure data can reveal whether cushioning distributes load or simply shifts it elsewhere. It can show asymmetry between the left and right foot, even when a wearer reports no pain. Small details matter: a bright red pressure zone beneath the second metatarsal, or a delayed heel release during gait.

Still, pressure maps are not magic. A clean image can mislead without reliable calibration, representative participants, and clinical interpretation. Global buyers should question sample size, testing speed, sensor durability, and population coverage. The method is powerful. It is not perfect. Used carefully, Dynamic Foot Pressure Analysis connects laboratory measurements with real walking experiences, helping buyers select safer, more adaptable, and genuinely market-ready footwear.
Why Do Global Buyers Need Dynamic Foot Pressure Analysis?

What Is Dynamic Foot Pressure Analysis?

Dynamic foot pressure analysis measures how force moves beneath the feet during walking, running, or standing. Unlike a static footprint, it captures timing, load distribution, pressure peaks, and contact duration. In practice, a person walks across a sensor platform or wears sensorized insoles. The system records each step, from heel strike to toe-off. It can reveal excessive pressure under the forefoot, uneven loading, or delayed weight transfer.

This matters because foot pressure changes with speed, footwear, fatigue, and surface conditions. The International Working Group on the Diabetic Foot identifies elevated plantar pressure as a modifiable risk factor for foot complications. Its 2023 prevention guideline supports regular risk assessment, although pressure thresholds are not universal. The American Diabetes Association’s Standards of Care in Diabetes 2024 also emphasizes routine foot evaluation for people with diabetes. The World Health Organization reports that diabetes affected about 830 million people worldwide in 2022, increasing the need for practical assessment tools.

For global buyers, the analysis helps compare insoles, footwear, orthotic designs, and rehabilitation programs using measurable evidence. A useful report should show peak pressure, pressure-time integral, gait symmetry, sampling rate, and test conditions. Numbers alone can mislead. Sensor drift, calibration errors, and unfamiliar walking patterns may distort results. Laboratory data may also differ from daily movement. The method is powerful, but not magic. Buyers should request repeated trials, transparent protocols, and validation data from independent testing.

Why Do Global Buyers Need Dynamic Foot Pressure Analysis?

What Is Dynamic Foot Pressure Analysis?

Dynamic foot pressure analysis measures how plantar pressure changes across the foot during walking. The chart shows representative pressure patterns across key gait phases, expressed in kilopascals (kPa). Comparing heel, midfoot, forefoot, and toe loading helps global buyers evaluate fit, cushioning, stability, pressure distribution, and potential high-load areas without relying only on static comfort tests.

How Does Dynamic Foot Pressure Analysis Work?

Dynamic foot pressure analysis converts each step into measurable evidence. A pressure platform or sensor insole records force beneath the heel, arch, metatarsals, and toes. It tracks peak pressure, contact time, loading rate, and the center-of-pressure path.

The process is practical. A buyer walks at a controlled speed across the platform, or wears instrumented insoles during normal movement. Software divides the stride into heel strike, mid-stance, and toe-off. Heat maps then reveal overloaded zones, uneven weight transfer, and delayed push-off. The International Diabetes Federation reported 537 million adults living with diabetes in 2021. This makes pressure monitoring relevant for footwear used by people facing elevated foot-risk concerns.

Numbers need context. A high forefoot reading may reflect poor fit, fast walking, stiff materials, or a natural gait pattern. One test is not enough. Repeated trials improve reliability, especially when comparing sizes, lasts, cushioning systems, or production samples. Research published in the Journal of Foot and Ankle Research has shown that plantar-pressure results can vary with speed, footwear, and testing conditions. Small details matter.

Global buyers can use these findings during supplier evaluation. They may request raw pressure maps, test protocols, participant details, and calibration records. That evidence is stronger than comfort claims alone. Still, dynamic analysis is not a diagnosis. Its limits deserve attention.

Which Biomechanical Insights Can It Reveal?

Dynamic foot pressure analysis shows how a person loads the ground while walking, running, or changing direction. Static measurements capture shape, but movement reveals timing and control. A pressure map can show whether the heel strikes evenly, whether the forefoot absorbs excessive force, and how quickly weight moves toward the toes.

These measurements also reveal biomechanical differences between both feet. One side may carry more load, while the other pushes off earlier. Such patterns can suggest compensation around the ankle, knee, hip, or lower back. Analysts can examine peak pressure, contact time, pressure distribution, and the center-of-pressure pathway. The results help guide footwear design, insole adjustment, rehabilitation planning, and product testing across different user groups.

The details matter.

In practical assessments, I have seen small pressure shifts appear only after several minutes of walking. Fatigue can change the result. Surface type, speed, body mass, and footwear can also influence the readings. Therefore, a single test should not become a medical diagnosis. It is better treated as measurable evidence that supports expert observation and repeated testing. Some interpretation remains imperfect. Human movement is adaptable, and pressure data cannot fully explain pain, comfort, or long-term injury risk without clinical context. Global buyers should request transparent test conditions, calibrated equipment, and clearly defined measurement methods before comparing products.

Why Do Global Buyers Need Dynamic Foot Pressure Analysis? - Which Biomechanical Insights Can It Reveal?

A representative dynamic gait dataset showing how pressure-time behavior can support footwear design, sizing, comfort evaluation, and product validation.

Dynamic Foot Pressure Analysis: Representative Biomechanical Insights
Biomechanical Dimension Example Dynamic Result Unit Observed Loading Pattern Biomechanical Insight Why It Matters to Global Buyers
Peak plantar pressure at the heel 258 kPa Moderate Indicates the magnitude of impact loading during initial contact. A higher value may reflect a harder heel strike, limited cushioning, or a faster walking or running speed. Supports comparison of cushioning systems, heel geometry, and shock-absorption performance across product samples.
Peak plantar pressure at the first metatarsal 392 kPa High loading Shows concentrated load beneath the medial forefoot during late stance and propulsion. Excessive concentration may be associated with reduced pressure redistribution. Helps assess forefoot cushioning, insole contouring, toe-box design, and suitability for users who stand or walk for long periods.
Peak plantar pressure at the hallux 421 kPa High propulsion load Reflects the contribution of the big toe during push-off. It can reveal how effectively the foot transfers force to the ground during propulsion. Useful for evaluating forefoot flexibility, toe-spring geometry, outsole stiffness, and athletic footwear performance.
Medial-to-lateral pressure ratio 1.34 : 1 ratio Medial bias A higher medial contribution may indicate greater inward loading during stance. Interpretation should be combined with foot posture, walking speed, and lower-limb alignment. Supports decisions about arch support, stability elements, dual-density materials, and regional fit requirements.
Center-of-pressure progression length 184 mm Continuous progression Describes how the center of pressure travels from the heel toward the forefoot. A shorter or interrupted path can indicate altered rollover or inconsistent contact. Enables objective comparison of sole curvature, rocker design, outsole transitions, and walking stability.
Center-of-pressure velocity during propulsion 0.86 m/s Controlled transfer Represents the speed of load transfer through the forefoot. Rapid transfer may reflect a stiff or highly responsive construction, while slower transfer may indicate greater compliance. Helps align product characteristics with intended use, including comfort walking, occupational footwear, and performance applications.
Total foot contact time 612 ms Extended contact Measures the duration from initial contact to toe-off. Longer contact time is commonly associated with slower gait, softer loading, or greater time spent stabilizing the foot. Useful for testing comfort, fatigue-related changes, occupational footwear, and fit consistency across different walking conditions.
Heel-to-toe load transfer time 386 ms Progressive rollover Shows how long pressure takes to move from the rearfoot to the forefoot. It provides insight into rollover efficiency and sole flexibility. Supports validation of flex grooves, forefoot bending zones, and product consistency between laboratory and real-world testing.
Left-right peak pressure difference 7.8 % difference Within common screening tolerance Indicates the degree of pressure asymmetry between the two feet. A meaningful difference may be related to leg dominance, previous injury, pain, or product fit. Helps identify sizing inconsistencies, asymmetric fit problems, and the need for left-right product or insole adjustments.
Pressure-time integral at the forefoot 82 kPa·s Sustained loading Combines pressure magnitude and exposure time. It can reveal cumulative mechanical demand that a peak-pressure value alone may not show. Important for assessing long-duration comfort, fatigue risk, insole durability, and suitability for high-use footwear categories.
Contact area during mid-stance 96 cm² Broad support Reflects how much of the plantar surface is actively engaged with the ground. A broader area can distribute load, although it should be interpreted alongside pressure magnitude and foot structure. Supports evaluation of insole coverage, arch contour, platform width, stability, and fit for varied foot shapes.
Gait-to-gait peak pressure variability 5.6 coefficient of variation (%) Consistent pattern Shows how repeatable the pressure distribution is across steps. Lower variability generally indicates a more consistent interaction between the foot and the footwear system. Improves reliability when comparing prototypes, production batches, sizes, climates, and user groups in different markets.

Note: The values above are representative screening data for a healthy adult walking at a self-selected pace. Actual results vary with body mass, gait speed, foot posture, footwear construction, sensor technology, and testing protocol; they should not be used as standalone clinical diagnostic thresholds.

Why Is It Important for Global Buyers?

Global buyers need dynamic foot pressure analysis because products face different feet, movements, and environments. A walking pattern in Berlin may differ from one in Bangkok or São Paulo. Foot shape, body weight, climate, and daily activity can change pressure distribution. Static measurements cannot show these changes clearly.

Dynamic analysis records pressure while a person walks, runs, turns, or climbs stairs. It can reveal heavy loading under the heel, uneven pressure near the forefoot, or delayed balance during movement. Small details matter. These findings help buyers compare product samples with greater confidence. They also support better decisions about cushioning, support, durability, and size ranges. In practical testing, calibrated sensors and repeated trials improve data reliability. Independent review can add another layer of trust.

The data is not perfect. A sensor may shift slightly, and one test subject cannot represent an entire market. That limitation deserves attention. Global buyers should request diverse participant groups, consistent testing conditions, and clear reporting methods. They should also compare pressure results with comfort feedback and long-term wear observations. Numbers alone may miss heat, fatigue, or personal preference. Careful buyers keep questioning the results, especially when a sample performs well in a controlled room but poorly on uneven streets.

How Can Buyers Evaluate Analysis Solutions?

Global buyers need dynamic foot pressure analysis because standing tests miss changing loads. A runner shifts weight within milliseconds, while a worker may twist on a hard floor. A useful solution should record pressure during walking, turning, stairs, and repeated tasks. I have seen attractive reports fail when they captured only one comfortable step. That weakness matters. Buyers should ask what movements the system measures, not merely how colorful its charts look.

Evaluation should begin with measurement quality. Check sensor resolution, sampling frequency, calibration procedures, and drift after long sessions. Ask for repeatability results from different users, foot sizes, speeds, and surface conditions. A credible supplier can explain testing methods and provide evidence from independent or qualified technical reviewers. Data should remain traceable, with timestamps, raw files, clear units, and documented processing steps. Without that detail, a precise-looking heat map may support a weak decision. Confirm privacy controls and regional data-handling practices before testing.

Usability deserves equal attention. Can trained staff prepare a test quickly? Can the software compare left and right loading, peak pressure, contact time, and changes across sessions? Exports should work with common analysis tools. Access controls should protect participant information. Buyers should test support response, training quality, and hardware replacement plans across regions. No system is perfect. I would run a small pilot before signing a large contract, using real footwear and ordinary working conditions. Results may expose limitations, but honest limitations are easier to manage than confident errors.

FAQS

What is dynamic foot pressure analysis?

It measures how force moves beneath the feet during walking, running, or standing. It captures real movement. The system records pressure, timing, load distribution, and contact duration.

How does the analysis work?

A person walks across a sensor platform or wears sensorized insoles. The system records each step from heel strike to toe-off. Software displays pressure maps and center-of-pressure paths.

Which foot areas can the test examine?

It can examine the heel, arch, forefoot, metatarsals, and toes. Results may show overloaded areas or delayed weight transfer. A bright heat-map zone can reveal concentrated pressure.

What measurements should a useful report include?

A useful report should include peak pressure and pressure-time integral. It should also show contact time, gait symmetry, sampling rate, and test conditions. Numbers need context.

How can buyers use this analysis?

Buyers can compare footwear, insoles, orthotic designs, and rehabilitation programs. They can request repeated trials across sizes or production samples. Measured evidence is stronger than comfort claims alone.

Which factors can change the results?

Walking speed, footwear, fatigue, surface conditions, and foot shape can affect pressure readings. Poor fit may increase forefoot pressure. Even unfamiliar walking can distort results.

Is one test enough for a reliable comparison?

Usually, one test is not enough. Repeated trials can improve reliability between products or designs. Small differences may come from sensor drift or calibration errors.

Can dynamic foot pressure analysis diagnose a foot problem?

No. It is an assessment tool, not a diagnosis. People with diabetes may need regular professional foot evaluation. The method helps identify pressure patterns, but it cannot explain every cause.

What should global buyers request from testing providers?

Buyers should request raw pressure maps, testing protocols, participant details, and calibration records. Independent validation data can strengthen confidence. Laboratory results may not match daily movement.

Conclusion

Dynamic Foot Pressure Analysis is a biomechanical assessment method that measures how pressure moves across the feet during walking, running, and other weight-bearing activities. Using pressure-sensitive platforms, insoles, or similar measurement systems, it captures data such as pressure distribution, loading time, balance, contact area, and changes throughout the gait cycle. This information helps reveal movement patterns, asymmetries, excessive loading, stability concerns, and how footwear or product designs influence comfort and performance.

For global buyers, these insights support more objective product development, quality evaluation, user research, and communication with technical partners across different markets. A reliable solution can help buyers compare designs, identify improvement opportunities, and make decisions based on measurable evidence rather than subjective impressions. When evaluating analysis solutions, buyers should consider measurement accuracy, repeatability, testing speed, software usability, data visualization, reporting capabilities, integration options, durability, training requirements, and after-sales technical support. The best choice should match the buyer’s intended applications, testing environment, budget, and long-term development goals.

Henry

Henry

Henry is a dedicated marketing professional with a profound expertise in the company's offerings. With years of experience in the industry, he possesses an impressive understanding of the market dynamics and consumer behaviors that drive success. Henry is committed to sharing his insights through......