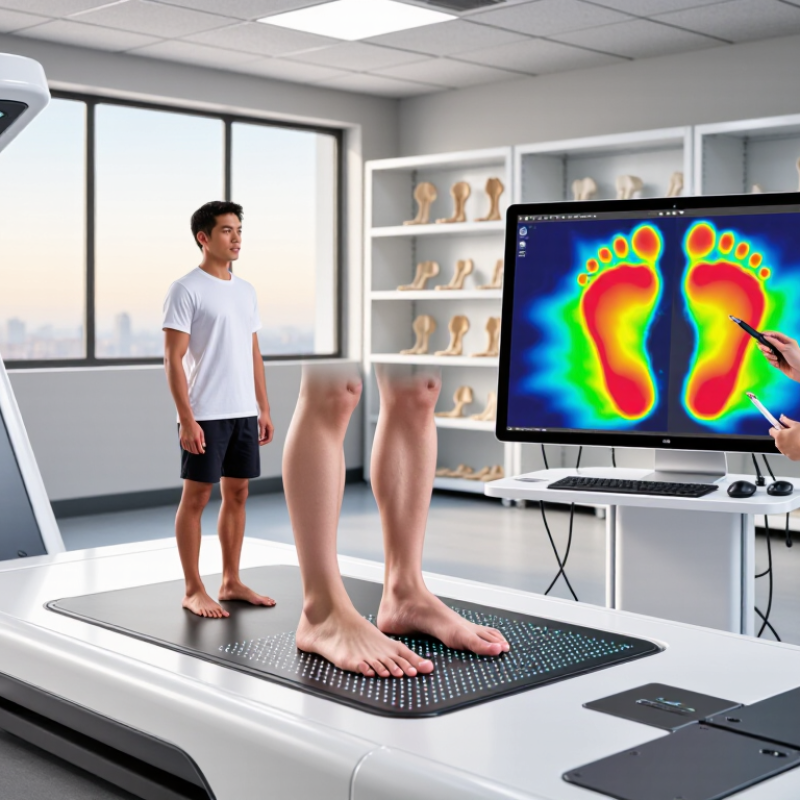
Podiatry Foot Pressure Analysis Equipment helps clinicians see how force moves beneath the feet during standing and walking. A patient steps onto a sensor platform, wears an instrumented insole, or walks across a pressure walkway. Thousands of sensors may record plantar pressure, contact time, loading rate, and balance changes. The result is more than a colorful heat map. It can reveal excessive pressure beneath the heel, metatarsal heads, or a specific toe.
Dr. Benno Nigg, a respected biomechanics researcher, has emphasized, “The human body is the best judge of what is comfortable.” This principle explains why pressure data should support clinical judgment, not replace it. Podiatrists compare measurements with symptoms, footwear, joint movement, skin condition, and walking habits. A patient may report burning under the forefoot while the display shows repeated high loading during push-off. That detail can guide footwear changes, orthotic design, exercise planning, or further assessment.
It is not magic.
Accurate interpretation depends on calibration, sensor placement, walking speed, and testing conditions. A poorly fitted insole can distort the picture. A single trial can also hide normal variation between steps. This equipment has limits, and clinicians must acknowledge them. Still, when used by trained professionals, Podiatry Foot Pressure Analysis Equipment provides measurable evidence for personalised care. It turns an invisible interaction between the foot and the ground into practical information. The best analysis remains careful, repeatable, and connected to the patient’s real experience.
Definition and Purpose of Podiatry Foot Pressure Analysis Equipment
What Is Podiatry Foot Pressure Analysis Equipment?
Definition and Purpose of Podiatry Foot Pressure Analysis Equipment
Podiatry foot pressure analysis equipment measures how force moves beneath the feet during standing and walking. It usually includes a sensor platform or thin sensing insoles. These sensors record pressure, timing, contact area, and weight distribution. The results appear as pressure maps, graphs, or gait measurements.
The equipment helps podiatrists investigate uneven loading, excessive pressure, and changes in walking patterns. A clinician may use it when assessing heel pain, forefoot discomfort, balance problems, or suspected gait abnormalities. It can also support diabetic foot screening by identifying repeated high-pressure areas. Small details matter, such as a red zone beneath the big toe or delayed heel contact.
Not a diagnosis by itself.
Reliable assessment requires repeated trials and proper calibration. The patient may walk barefoot, wear shoes, or use prescribed insoles, depending on the clinical question. Experienced practitioners compare the data with medical history, physical examination, footwear, and movement observations. A pressure map can look decisive, but it is only one measurement. Results may change with fatigue, walking speed, or unfamiliar surroundings. This is where professional judgment remains essential. The equipment can guide treatment planning, monitor rehabilitation, and help refine orthotic support, but it cannot replace careful clinical reasoning.
Core Technologies Used to Measure Foot Pressure
What Is Podiatry Foot Pressure Analysis Equipment?
Core Technologies Used to Measure Foot Pressure
Podiatry foot pressure analysis equipment measures how force moves beneath the feet during standing and walking. Pressure platforms use arrays of small sensors. Each sensor records load, contact time, and location. In-shoe systems place thin sensing layers inside footwear. They capture pressure during everyday steps, not only clinic walking.
The International Diabetes Federation’s Diabetes Atlas reports 537 million adults had diabetes in 2021. This matters because repeated high pressure can contribute to tissue damage, especially when protective sensation is reduced. The 2023 IWGDF Prevention Guideline supports structured foot-risk assessment, while pressure measurement can add objective movement evidence. A clinician may compare peak pressure, pressure-time integral, and left-right loading. Short steps can reveal a problem.
Optical or video gait systems show movement, but they do not directly measure plantar force. Force plates measure ground-reaction force, while pressure mats show its distribution under the foot. Software then converts sensor readings into color maps and graphs. A colorful map can look authoritative. It is not a diagnosis.
Calibration drift, walking speed, footwear, and sensor placement can change results. Even a careful assessment may miss pain reported only after several hours. Professional interpretation remains essential, and repeated testing under similar conditions improves reliability.
How Foot Pressure Analysis Equipment Works
What Is Podiatry Foot Pressure Analysis Equipment?
How Foot Pressure Analysis Equipment Works
Foot pressure analysis equipment uses sensors to record how force moves beneath the feet. A patient may stand barefoot on a pressure platform or walk across it. Some systems use thin sensor insoles inside shoes. These sensors capture pressure changes during each step.
The software converts this information into visual maps, pressure values, and timing data. A podiatrist can observe heel loading, forefoot pressure, balance, and the center of pressure. During walking, the system shows how pressure travels from heel to toe. It may also reveal uneven loading between the left and right feet. Useful details appear quickly.
However, one test cannot explain every foot problem. Walking speed, fatigue, footwear, and sensor placement can affect the results. I have found that repeat testing sometimes produces slightly different patterns. This is not necessarily equipment failure. The findings should be considered alongside medical history, physical examination, gait observation, and the patient’s reported discomfort. A trained professional must interpret the data rather than relying on colorful charts alone.
Tips:
Let the patient walk naturally. Avoid forcing a “perfect” step. Calibrate the equipment before testing and check the sensor surface for damage. Record whether the test uses bare feet or footwear. Repeat the assessment when results seem unclear. Small details matter.
Clinical Applications in Podiatry and Biomechanical Assessment
Podiatry foot pressure analysis equipment measures how force moves beneath the feet during standing and walking. Sensorized mats, pressure platforms, and in-shoe systems capture peak pressure, contact time, load distribution, and center-of-pressure paths. Clinicians can compare the left and right foot within seconds. The screen may show a bright red zone beneath the first metatarsal. That image often makes an invisible problem easier to discuss.
Clinical value is strongest when data supports examination, not replaces it. The International Diabetes Federation reported 537 million adults living with diabetes in 2021. Diabetic neuropathy can reduce pain awareness and increase ulcer risk. Pressure mapping helps identify repeated loading near the heel, forefoot, or toes. The 2023 IWGDF guidelines emphasize structured foot-risk assessment and prevention. Pressure results may guide footwear changes, orthotic design, gait education, or follow-up intervals. WHO’s 2022 musculoskeletal health report also estimates that 1.71 billion people live with musculoskeletal conditions worldwide. Their gait may reveal compensation after injury, arthritis, or weakness.
Biomechanical assessment adds movement context. Force plates can examine loading rates, balance, and push-off efficiency. Clinicians may pair these findings with video, joint examination, and patient history. One limitation matters. The reading is not the patient. Calibration drift, walking speed, socks, fatigue, and unfamiliar surroundings can alter results. A single trial may mislead. Repeated measurements are safer, though they still require professional interpretation. Some clinical decisions remain partly subjective, and that should be acknowledged.
Key Factors for Selecting Foot Pressure Analysis Equipment
What Is Podiatry Foot Pressure Analysis Equipment?
Key Factors for Selecting Foot Pressure Analysis Equipment
Podiatry foot pressure analysis equipment measures how force moves beneath the foot during standing and walking. It may use sensor platforms, pressure mats, or in-shoe systems. Clinicians use these measurements to identify overloaded areas, uneven loading, and changes in gait. The data can support orthotic design, diabetic foot screening, and rehabilitation planning.
Selection should begin with clinical purpose, not impressive specifications. A clinic assessing walking needs suitable sampling frequency, reliable spatial resolution, and clear pressure maps. The system should also provide repeatable results across sessions. Calibration matters. Small errors can change an apparent “high-pressure” zone. The International Working Group on the Diabetic Foot reports a lifetime diabetic foot ulcer risk of 19% to 34%. That makes dependable screening evidence especially important.
Check whether the equipment has independent validation, documented accuracy, and software that exports raw data. According to the International Diabetes Federation’s 2021 Diabetes Atlas, 537 million adults aged 20–79 lived with diabetes worldwide. Practical workflow matters too. A busy clinic needs quick setup, hygienic surfaces, and readable reports. Data privacy and secure storage should not be afterthoughts. Neither should staff training.
More sensors are not always better.
A useful test is simple: can different clinicians interpret the same result similarly? Equipment should complement clinical examination, not replace it. I would also question unusually precise readings without transparent methods. That skepticism is healthy. No pressure system captures every movement perfectly. Temperature, footwear, walking speed, and patient fatigue can influence results. Selection should therefore balance evidence, usability, maintenance, and the real patients seen every day.
Conclusion
Podiatry Foot Pressure Analysis Equipment is designed to measure how pressure is distributed across the feet during standing, walking, and other movements. By capturing pressure levels, contact timing, weight transfer, and balance patterns, it helps clinicians understand foot function and identify abnormal loading. Common technologies include pressure-sensitive platforms, sensor-based insoles, and computerized gait analysis systems. These tools convert physical pressure into visual data, allowing practitioners to review results through pressure maps, force curves, and movement reports.
In podiatry and biomechanical assessment, this equipment can support the evaluation of gait problems, posture, balance, sports-related stress, and conditions involving uneven foot loading. It may also assist with treatment planning, orthotic design, rehabilitation monitoring, and measuring changes over time. When selecting Podiatry Foot Pressure Analysis Equipment, important factors include measurement accuracy, sensor durability, sampling speed, testing area, software usability, patient comfort, data storage, and compatibility with clinical workflows. The most suitable system should provide reliable information while remaining practical for everyday assessment.

 MedTrack