A Foot Pressure Mapping System can help buyers visualize how pressure moves across the foot during standing, walking, or other assessment tasks. The right setup may support clinical evaluation, rehabilitation planning, sports analysis, or product development. Yet the most impressive display is not automatically the most useful one. Buyers should match system capabilities to the people, movement tasks, and decisions involved.
A clear pressure map is only one part of the picture. Sensor resolution, sampling rate, calibration procedures, and repeatability affect how confidently users can interpret results. Details matter. Software should make it practical to review trials, compare measurements, and export reports without adding unnecessary steps. Consider the real workspace, too: a pressure platform must fit the available floor area, and wearable insoles require appropriate sizing and maintenance. Ask vendors to demonstrate representative tasks, explain setup requirements, and clarify training and technical support. Check how the system handles different walking speeds and whether its measurements are validated for the intended use. Not always. A polished demo may not reflect everyday workflow, and more data can create more interpretation work. This guide compares leading options by practical buyer criteria rather than headline specifications alone. Use it to identify suitable systems, prepare informed questions, and judge trade-offs before purchase. Independent evaluation remains important; device capabilities and evidence can vary by model, software version, and application.
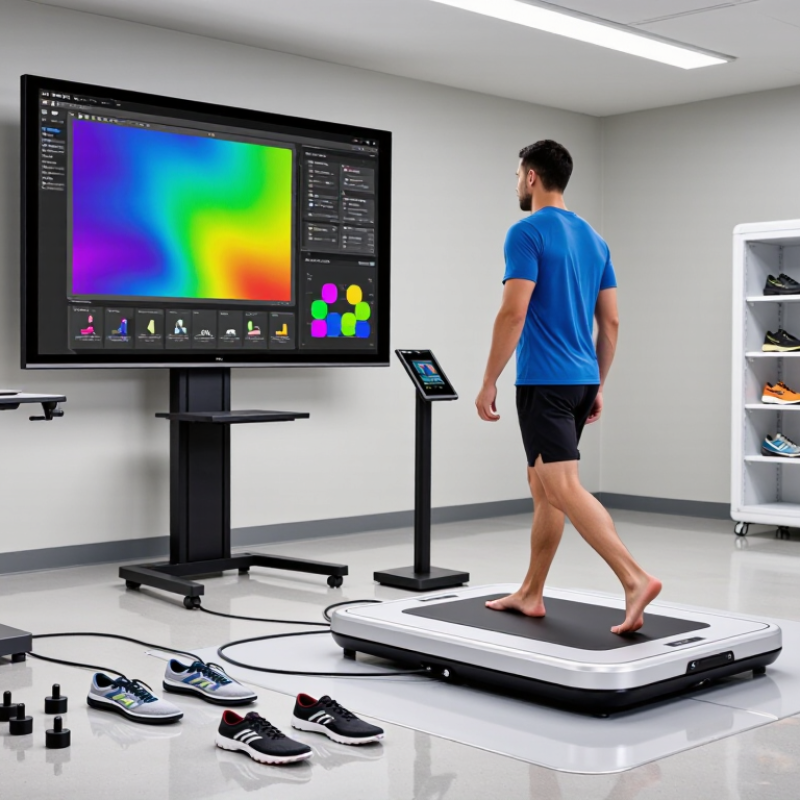
Foot pressure mapping shows how load moves across the sole during standing or walking. Three measures matter. Pressure, reported in kilopascals (kPa), is force divided by contact area. Force describes the load on the foot, usually in newtons. Contact area shows how much of the sole touches the sensor at a given moment. A small, bright patch beneath the forefoot can indicate concentrated loading, but color alone is not a diagnosis.
The IWGDF 2023 prevention guideline uses less than 200 kPa at high-risk foot locations, or a pressure reduction above 30%, as benchmarks for therapeutic footwear. These are clinical targets, not universal pass-or-fail limits for every mapping system. Buyers should check calibration, sensor resolution, sampling rate, and whether measurements are taken inside footwear or on a platform. Those setups answer different questions. A platform may capture a barefoot step; an in-shoe system records pressure within the shoe during use. One caveat: gait speed, sensor placement, and repeatability can shift readings. Ask for validation details and test the same person across repeated steps before comparing small differences.
| Metric | Definition and calculation | Unit | Illustrative value | What buyers should check |
|---|---|---|---|---|
| Foot pressure mapping | A measurement method that records the distribution of pressure across the plantar surface of the foot, usually at multiple sensor locations and over time. | Commonly displayed in kPa | A map may show higher pressure beneath the heel or forefoot than in areas with lighter contact. | Check whether the system displays a spatial pressure map, records measurements over time, and reports how values are calculated from its sensors. |
| Pressure | Force applied perpendicular to a surface divided by the area over which that force acts: pressure = force ÷ area. | Pa or kPa; 1 kPa = 1,000 Pa | 400 N distributed over 80 cm² equals 50 kPa average pressure. | Confirm whether readings are reported per sensor, per region, or across the whole contact area, and whether the displayed value is instantaneous or averaged. |
| Peak pressure | The highest pressure recorded at a sensor location or within a defined foot region during a measurement period. | kPa | A trial might report a regional peak of 220 kPa while the whole-foot average is lower. | Check the system’s peak-detection method, sensor range, and whether the peak is reported for a single sensor or a grouped region. |
| Mean pressure | Average pressure across a stated contact area or measurement interval. The averaging method should be specified because different methods can produce different results. | kPa | 400 N ÷ 0.008 m² = 50,000 Pa = 50 kPa, when force and area refer to the same instant and contact region. | Look for a clear definition of the averaging area and time window; do not assume that a system’s mean is directly comparable with another system’s mean. |
| Force | The load measured perpendicular to the sensing surface. A system may estimate total normal force by summing the forces measured across its active sensors. | Newtons (N) | 400 N is approximately the weight force of a 40.8 kg mass under standard gravity (9.81 m/s²); this is a unit comparison, not a body-mass estimate from one foot. | Check whether force is reported for one foot, a selected region, or both feet, and whether the system measures normal force only or also measures shear force. |
| Contact area | The area classified by the system as being in contact with the foot under its specified detection threshold. | cm² or m² | 80 cm² = 0.008 m². | Ask how contact is defined, including the pressure threshold, sensor spacing, and treatment of partially loaded sensors; these choices affect the reported area. |
| Pressure-time integral | Pressure accumulated over a stated time interval; mathematically, pressure integrated with respect to time. | kPa·s | A constant 50 kPa over 0.4 s gives a pressure-time integral of 20 kPa·s. | Check the integration interval and whether results are reported for individual sensors, foot regions, or the complete contact area. |
| Center of pressure (COP) | The weighted location of the measured pressure or force distribution on the sensing surface. Its movement can be tracked during a stance or balance task. | Position in mm or cm | A COP trace may be reported as a path across the sensor surface during a recorded trial. | Check the coordinate system, sampling rate, and whether COP is calculated from all active sensors or a selected region. |
Calculation note: The numerical examples are illustrative calculations, not clinical thresholds or recommended targets. For reliable comparisons, use consistent footwear or barefoot conditions, sensor calibration, contact-area definitions, task instructions, and analysis settings.
It should capture the heel, arch, metatarsal heads, and toes without gaps. Check the active sensing area against shoe size and walking tasks.
Wide spacing or a narrow mat may miss toe-off or clip heel strike. Check the edges.
Compare its working range with expected loads. A high pressure ceiling can prevent saturation, but does not guarantee detail at lower pressures.
Review accuracy, resolution, and repeatability across the pressure range. Ask how calibration works and how often it is recommended. Test a known load if possible.
Use the same footwear, firm level floor, and walking speed. Record calibration dates and repeat tests when patterns look unexpectedly different. Small details matter.
Similar conditions should produce similar results, but perfect agreement is unrealistic. Footwear, speed, fatigue, and small placement shifts can change readings.
Confirm access to underlying measurements, file formats, units, timestamps, and clear left-right foot labels. Open a sample export in your team’s usual tools.
Ask who handles setup questions, how quickly they respond, and whether training materials are available. Try asking about a confusing export step. That can reveal gaps.
No. Compare several short walking or standing trials and review the workflow. I would not trust one neat demo; small daily hassles are easy to overlook.
A Foot Pressure Mapping System measures how pressure is distributed beneath the feet during standing or movement. Understanding its core metrics—pressure in kPa, force, and contact area—helps buyers interpret results and compare systems effectively. Sampling rate also matters: in-shoe systems commonly capture data at 100–200 Hz, while force plates may record at around 1,000 Hz, making them useful for different types of movement analysis.
When comparing options, consider sensor coverage, calibration methods, and whether the pressure range, potentially up to 600 kPa, suits the intended workflow. In-shoe devices, pressure walkways, and mats each support different testing environments and needs. Before selecting a system, assess repeatability, data export options, ease of use, and the availability of technical support to ensure the collected measurements are consistent and practical for ongoing analysis.

 MedTrack