Choosing the best Pedobarography System is not a simple comparison of prices and sensor counts. The right platform must match the clinical question, patient population, and workflow.
The International Diabetes Federation’s 2021 Diabetes Atlas estimated that 537 million adults were living with diabetes worldwide. That figure strengthens the need for reliable plantar-pressure assessment, especially in diabetic-foot care. Industry analyses from Grand View Research and MarketsandMarkets also show expanding demand for pressure-sensing and gait-analysis technologies. However, market growth does not prove that every system performs equally well. That distinction matters.
David G. Armstrong, a leading diabetic-foot specialist, has stated, “The best way to prevent an amputation is to prevent the first ulcer.” A Pedobarography System can support that goal by revealing high-pressure zones beneath the metatarsal heads, heel, or hallux. Still, pressure maps are not clinical diagnoses. They require calibration, repeatable protocols, suitable spatial resolution, and trained interpretation. Dynamic measurements may expose problems that static assessments miss.
This guide examines sensor technology, sampling frequency, accuracy, software usability, patient safety, and after-sales support. It also considers integration with orthotics, rehabilitation, sports medicine, and research workflows. A glossy demonstration can hide weak validation. A cheaper system may become expensive when data export fails or technical support disappears.
There is no universally best platform. That answer is uncomfortable. The strongest choice is the system that produces trustworthy data under real clinical conditions, not merely impressive images in a showroom.
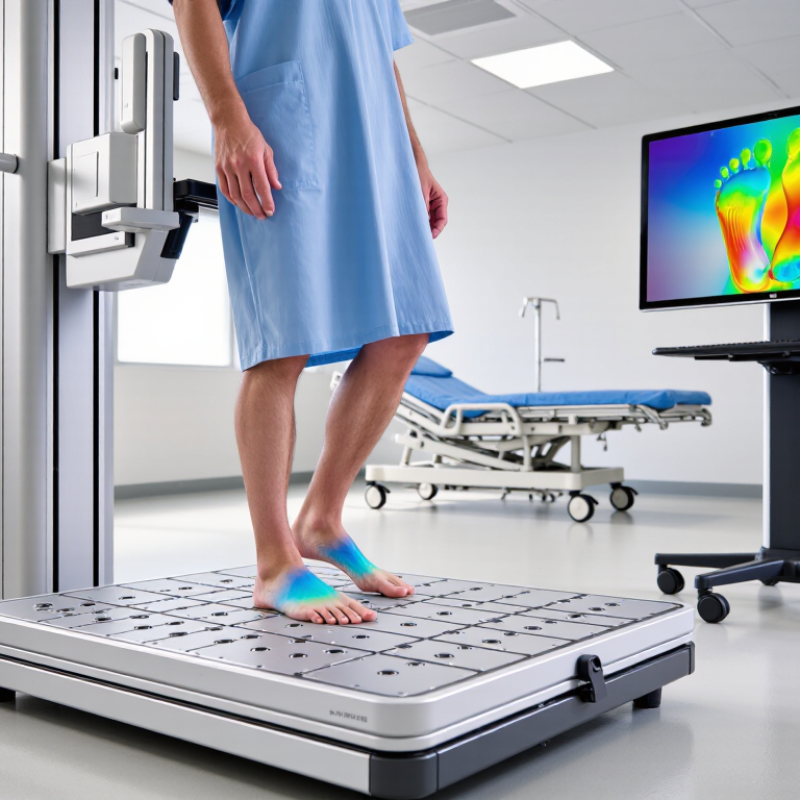
A pedobarography system measures how pressure moves beneath the foot during standing and walking. Its sensors record peak plantar pressure, contact area, pressure-time integral, and the center of pressure path. These measurements reveal where load concentrates, such as under the heel, metatarsal heads, or big toe.
The system also captures timing. It shows when each region contacts the ground and how long pressure remains there. A pressure map can look like a heat trail across a clinic floor. High pressure does not automatically mean injury. However, repeated loading may matter, especially when sensation is reduced. The IDF Diabetes Atlas, 10th edition, estimated that 537 million adults lived with diabetes in 2021. This population has a greater need for careful foot-risk assessment. The IWGDF 2023 prevention guidelines recognize abnormal plantar pressure as one factor linked with diabetic foot ulcer risk.
Accuracy depends on the test. Footwear, walking speed, sensor calibration, and patient fatigue can change the results. A barefoot scan may not represent pressure inside a work shoe. That matters. Experienced clinicians compare both feet, repeat useful trials, and examine the person’s history. A single colorful image is not a diagnosis. It is evidence that needs context. I still find this easy to overlook. A reliable system should therefore provide repeatable measurements, clear reports, and data that clinicians can interpret without guessing.
How to Choose the Best Pedobarography System?
Identifying Clinical or Research Requirements
Start with the question behind the measurement. A diabetic foot clinic may need fast screening, simple reports, and repeatable results. A biomechanics laboratory may require high spatial resolution, adjustable sampling rates, and raw data access. These needs rarely fit one configuration. The International Diabetes Federation reported 537 million adults living with diabetes in 2021. This growing clinical workload makes efficient plantar-pressure assessment increasingly relevant. IWGDF’s 2023 guidelines also identify elevated plantar pressure as an important factor in diabetic foot risk assessment.
Clinical users should examine workflow before technical specifications. Can staff position patients consistently? Can the system manage barefoot and shod tests? Does it support cleaning between examinations? Calibration records, sensor durability, and software traceability matter more than impressive peak-pressure images. A clear report can support communication between clinicians. It cannot replace clinical judgment.
Research teams need stronger control over variables. Check synchronization with motion capture, force plates, or electromyography. Confirm the sampling frequency and exported file formats. Test repeatability across walking speeds, operators, and sessions. A single trial may look convincing. It may still be misleading. In my experience, researchers often underestimate setup time and subject adaptation. That weakness deserves attention. Published validation data should include participant numbers, test conditions, and error measurements. Compare those details with your protocol, not only with a product brochure.
Choosing the best pedobarography system starts with its sensor type. Resistive sensors are practical and often affordable, but their readings may drift under repeated loading. Capacitive sensors can provide stable pressure data and better sensitivity across many walking cycles. Optical systems capture pressure distribution with strong spatial detail, although they may require careful calibration and controlled lighting.
Accuracy depends on more than the sensor itself. Check the stated pressure range, sampling frequency, spatial resolution, and calibration method. A system should record quiet standing, walking, running, and uneven loading without losing contact data. In clinical experience, small timing errors can change the interpretation of heel strike or toe-off. This matters. Test-retest results are also important. If the same person produces different maps within minutes, the system may need better setup control. No device is perfect, and published specifications do not always reflect daily use.
Tips: Ask for raw data access, not only colorful pressure maps. Compare measurements using the same footwear, speed, and surface. Check whether the platform supports force, pressure, contact area, and center-of-pressure tracking. A wider measurement area helps when stride length varies. Also review software training, maintenance needs, and data export options. These details often decide whether a technically impressive system becomes genuinely useful.
Representative comparison of commonly reported sensor characteristics in pedobarography. Resistive and capacitive sensors can measure sustained plantar pressure, while piezoelectric sensors are better suited to fast-changing pressure events and are generally unsuitable for static-load measurement. Sampling values are typical reference values rather than universal specifications; accuracy also depends on calibration, sensor density, hysteresis, temperature, and foot-loading conditions.
Software determines whether pressure data becomes clinical evidence or unused color maps. A practical evaluation should begin with a real workflow. Ask a technician to place sensors, calibrate the platform, record a walking trial, and export results. Watch the clock. Can the process finish within ten minutes? Are peak pressure, contact area, force-time curves, and left-right comparisons easy to locate?
The Nielsen Norman Group reports that testing with five users can reveal about 85% of serious usability problems. That figure supports a simple trial with clinicians, technicians, and patients. Menus should require minimal training. Labels should remain clear when displayed beside a patient’s foot. Small details matter, such as automatic trial naming and visible calibration warnings. I would not trust attractive graphics alone. Some systems still hide raw values behind several screens.
Compatibility deserves equal attention. The Office of the National Coordinator’s 2023 interoperability reporting showed that roughly seven in ten hospitals routinely used core exchange functions, including finding, sending, receiving, and integrating health information. A pedobarography system should support practical data exchange, not only produce PDF reports. Check CSV export, application programming interfaces, user permissions, and electronic record integration. Test them with your existing computers. Poor compatibility can turn a fast assessment into manual retyping. That weakness is easy to underestimate. My own evaluation checklist would include failed exports, because real workflows are rarely perfect.
How to Choose the Best Pedobarography System?
Assessing Cost, Support, and Long-Term Value
A low purchase price can hide expensive limitations. In clinical evaluations, I examine sensor durability, software updates, calibration needs, and data export options. A system should produce consistent readings after repeated walking trials, not only during a product demonstration. Ask for documented accuracy, testing conditions, and maintenance requirements. Technical evidence matters more than polished sales language.
Tips: Request a total-cost estimate for five years. Include installation, training, repairs, upgrades, and replacement sensors. Check response times for technical support. Ask whether support staff understand gait analysis, clinical workflows, and common measurement errors. Trial the reporting software with your own assessment protocol. Small delays become frustrating.
Long-term value also depends on staff confidence. Clear training can reduce setup mistakes and improve repeatability between examiners. Look for practical onboarding, user manuals, remote guidance, and access to qualified technicians. I once focused too heavily on hardware specifications and underestimated software learning time. That decision slowed our assessments. It also showed me that “easy to use” needs direct testing, not assumption. Consider data security, compatibility with existing systems, and the supplier’s history of sustained support. A cheaper system may become costly when integration fails or essential parts become unavailable.
It measures pressure beneath the foot during standing and walking. Sensors record peak pressure, contact area, and pressure-time patterns. It also tracks the center of pressure path.
Pressure may gather under the heel, forefoot, or big toe. A heat-like map shows these areas clearly. The colors need clinical interpretation.
No. High pressure does not automatically mean tissue damage. Repeated loading may still matter, especially when foot sensation is reduced. Context matters.
Barefoot results may not represent pressure inside work shoes. Footwear changes load distribution and contact timing. Test conditions should match daily activities when possible.
No. One colorful image is only supporting evidence. Clinicians should compare both feet, review history, and repeat useful trials. I still find this easy to overlook.
Ask staff to place sensors, calibrate the platform, record walking, and export results. The workflow should finish quickly. Clear labels and visible calibration warnings help.
Useful systems may offer CSV files, application programming interfaces, user permissions, and record-system integration. Test exports on existing computers. Manual retyping creates avoidable errors.
Include installation, training, repairs, updates, calibration, and replacement sensors. Request a five-year estimate. A low purchase price can hide costly limitations.
Support should include practical training, clear manuals, remote guidance, and qualified technical help. Staff confidence improves repeatability. “Easy to use” needs direct testing, not assumptions.
Walking speed, footwear, calibration, and patient fatigue can change results. Repeated trials improve confidence. The measurement is useful, but never perfect.
Choosing the right Pedobarography System begins with understanding what it measures, including plantar pressure distribution, force patterns, timing, and changes in foot loading during standing or movement. Buyers should first define whether the system is intended for clinical assessment, rehabilitation, gait analysis, sports performance, or research, since each application may require different sampling rates, measurement areas, portability, and data precision.
It is also important to compare sensor technologies, accuracy, durability, and the ability to capture static and dynamic measurements. Software should provide clear visual reports, flexible data analysis, easy operation, and compatibility with existing clinical or research workflows. Finally, evaluate the total cost of ownership, including installation, training, maintenance, upgrades, and technical support. A system that balances reliable measurements, practical usability, future compatibility, and dependable service will generally offer greater long-term value than one selected solely for its initial price.

MedTrack